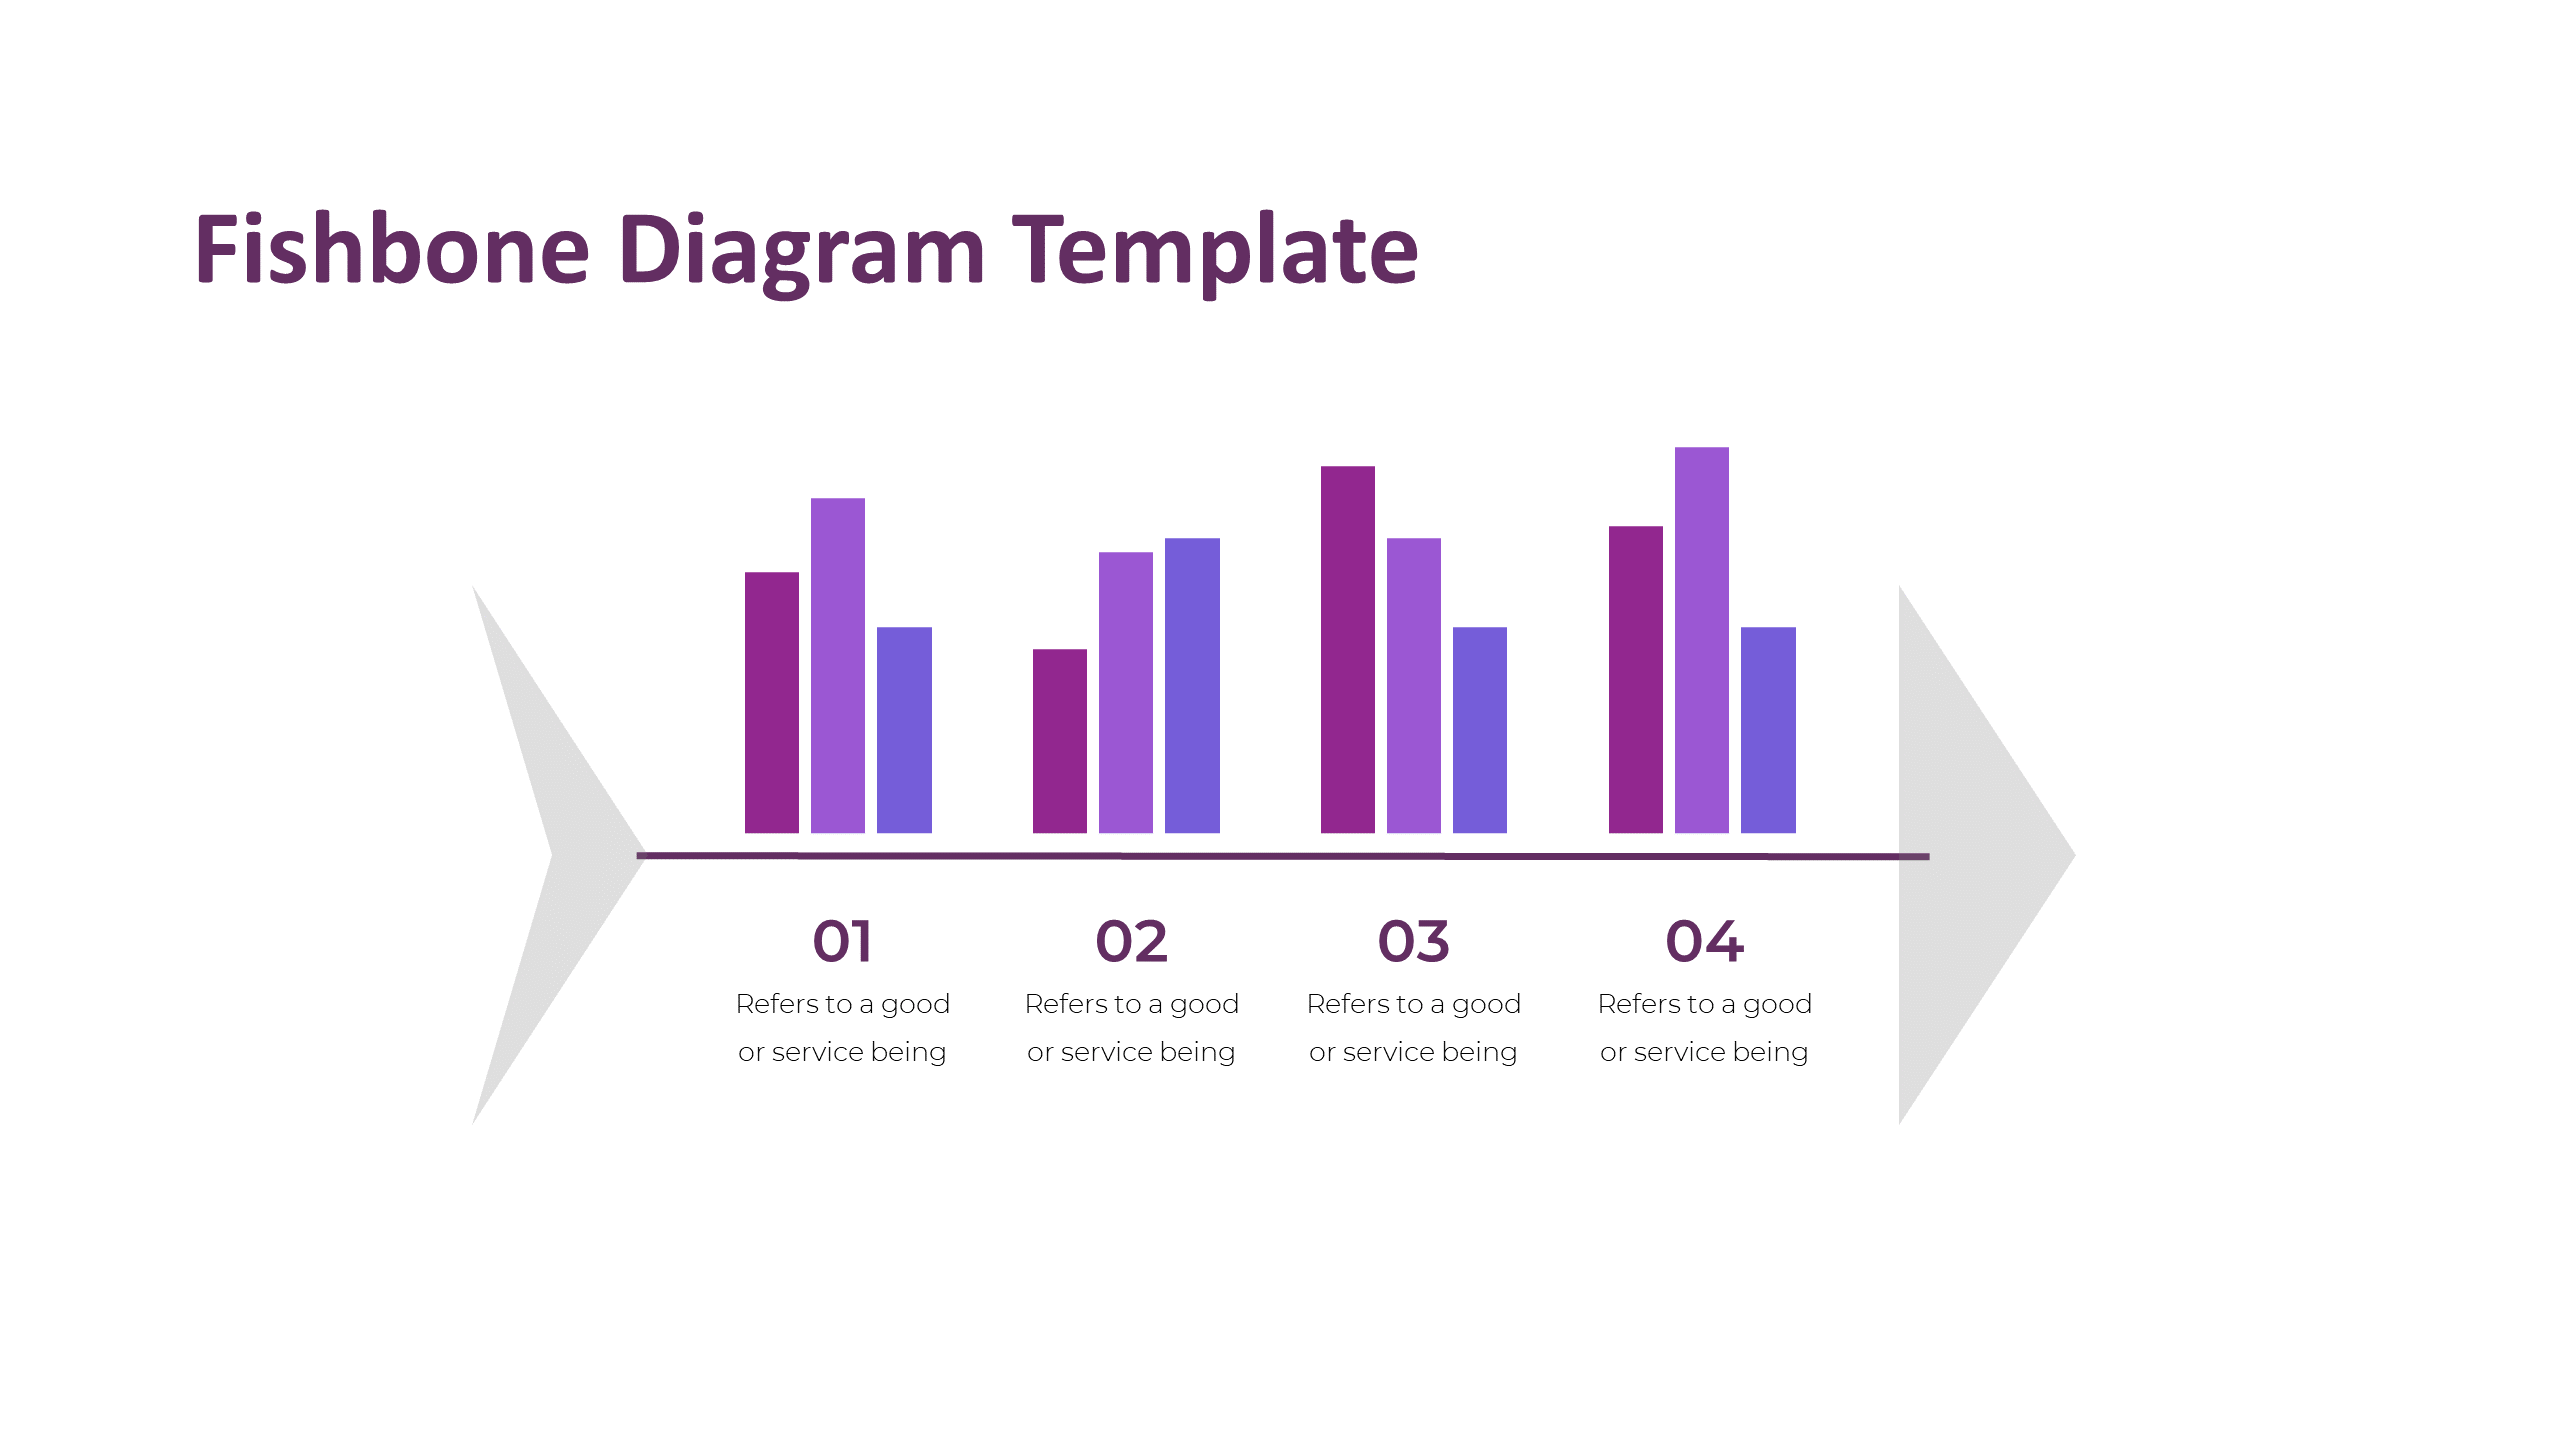
Perform Root Cause Analysis with Our Free Editable Bar Graph Fish Bone Analysis Slide Design
Introduction:In the realm of problem-solving and decision-making, the
Fishbone Analysis, also known as the Ishikawa or cause-and-effect diagram, is a potent tool. It's designed to help teams identify, explore, and visually exhibit the potential causes of a specific issue or quality variation. We're thrilled to present
our 100% editable Bar Graph Fish Bone Analysis , crafted to make this process more straightforward and efficient.
Importance of Bar Graph Fish Bone Analysis:
Bar Graph Fish Bone Analysis is a structured brainstorming technique that aims to identify and visually display the potential causes of a specific problem. The diagram resembles a fish's skeleton, with the main problem represented as the fish's head and the causes as the bones. Hence, the visual representation is crucial as it helps teams to systematically identify, explore, and graphically display the many causes linked to a problem or quality variation. Moreover, It encourages teams to consider all possible causes, rather than focusing on the most obvious ones, leading to more effective problem-solving and decision-making.
Why Perform Fishbone Analysis?
The Fishbone Analysis is performed to identify the root causes of a problem, not just the symptoms. Also, It allows teams to dig deeper into a problem by looking at its broader context and the interrelationships between different factors. Therefore, This comprehensive approach can lead to more effective solutions and prevent the same issues from recurring in the future.
Who Should Use This Bar Graph Fish Bone Analysis Template?
Our Fishbone Analysis slide is a versatile tool that can be used by anyone involved in problem-solving or decision-making processes. Also, This includes project managers, business analysts, quality control teams, process improvement teams, and more. Whether you're trying to improve a business process, increase product quality, or resolve a recurring issue, this template can help you conduct a thorough and effective Fishbone Analysis.
Benefits of Using Our Bar Graph Fish Bone Analysis Slide:
Our
Bar Graph Fish Bone Analysis slide is 100% editable, allowing you to customize it to fit your specific needs. Here are some of the benefits you can gain from using this template:
- Simplified Problem-Solving: The template provides a clear, easy-to-understand layout that simplifies the process of conducting a Fishbone Analysis.
- Comprehensive Analysis: It encourages a comprehensive approach to problem-solving, helping you identify all potential causes of a problem, not just the most obvious ones.
- Effective Communication: The visual nature of the Fishbone Diagram makes it easier to communicate your findings to others, facilitating better understanding and collaboration.
- Time-Saving: Moreover, The template saves you time by providing a ready-made format for conducting a Fishbone Analysis. All you need to do is fill in the details.
Conclusion:
Our 100% editable
Bar Graph Fish Bone Analysis slide is a powerful tool that can help you conduct a thorough and effective Fishbone Analysis. Thus, By visually displaying the potential causes of a problem, it can lead to a more comprehensive understanding and effective solutions. Download it today and start solving problems more effectively!


