Popular Keywords
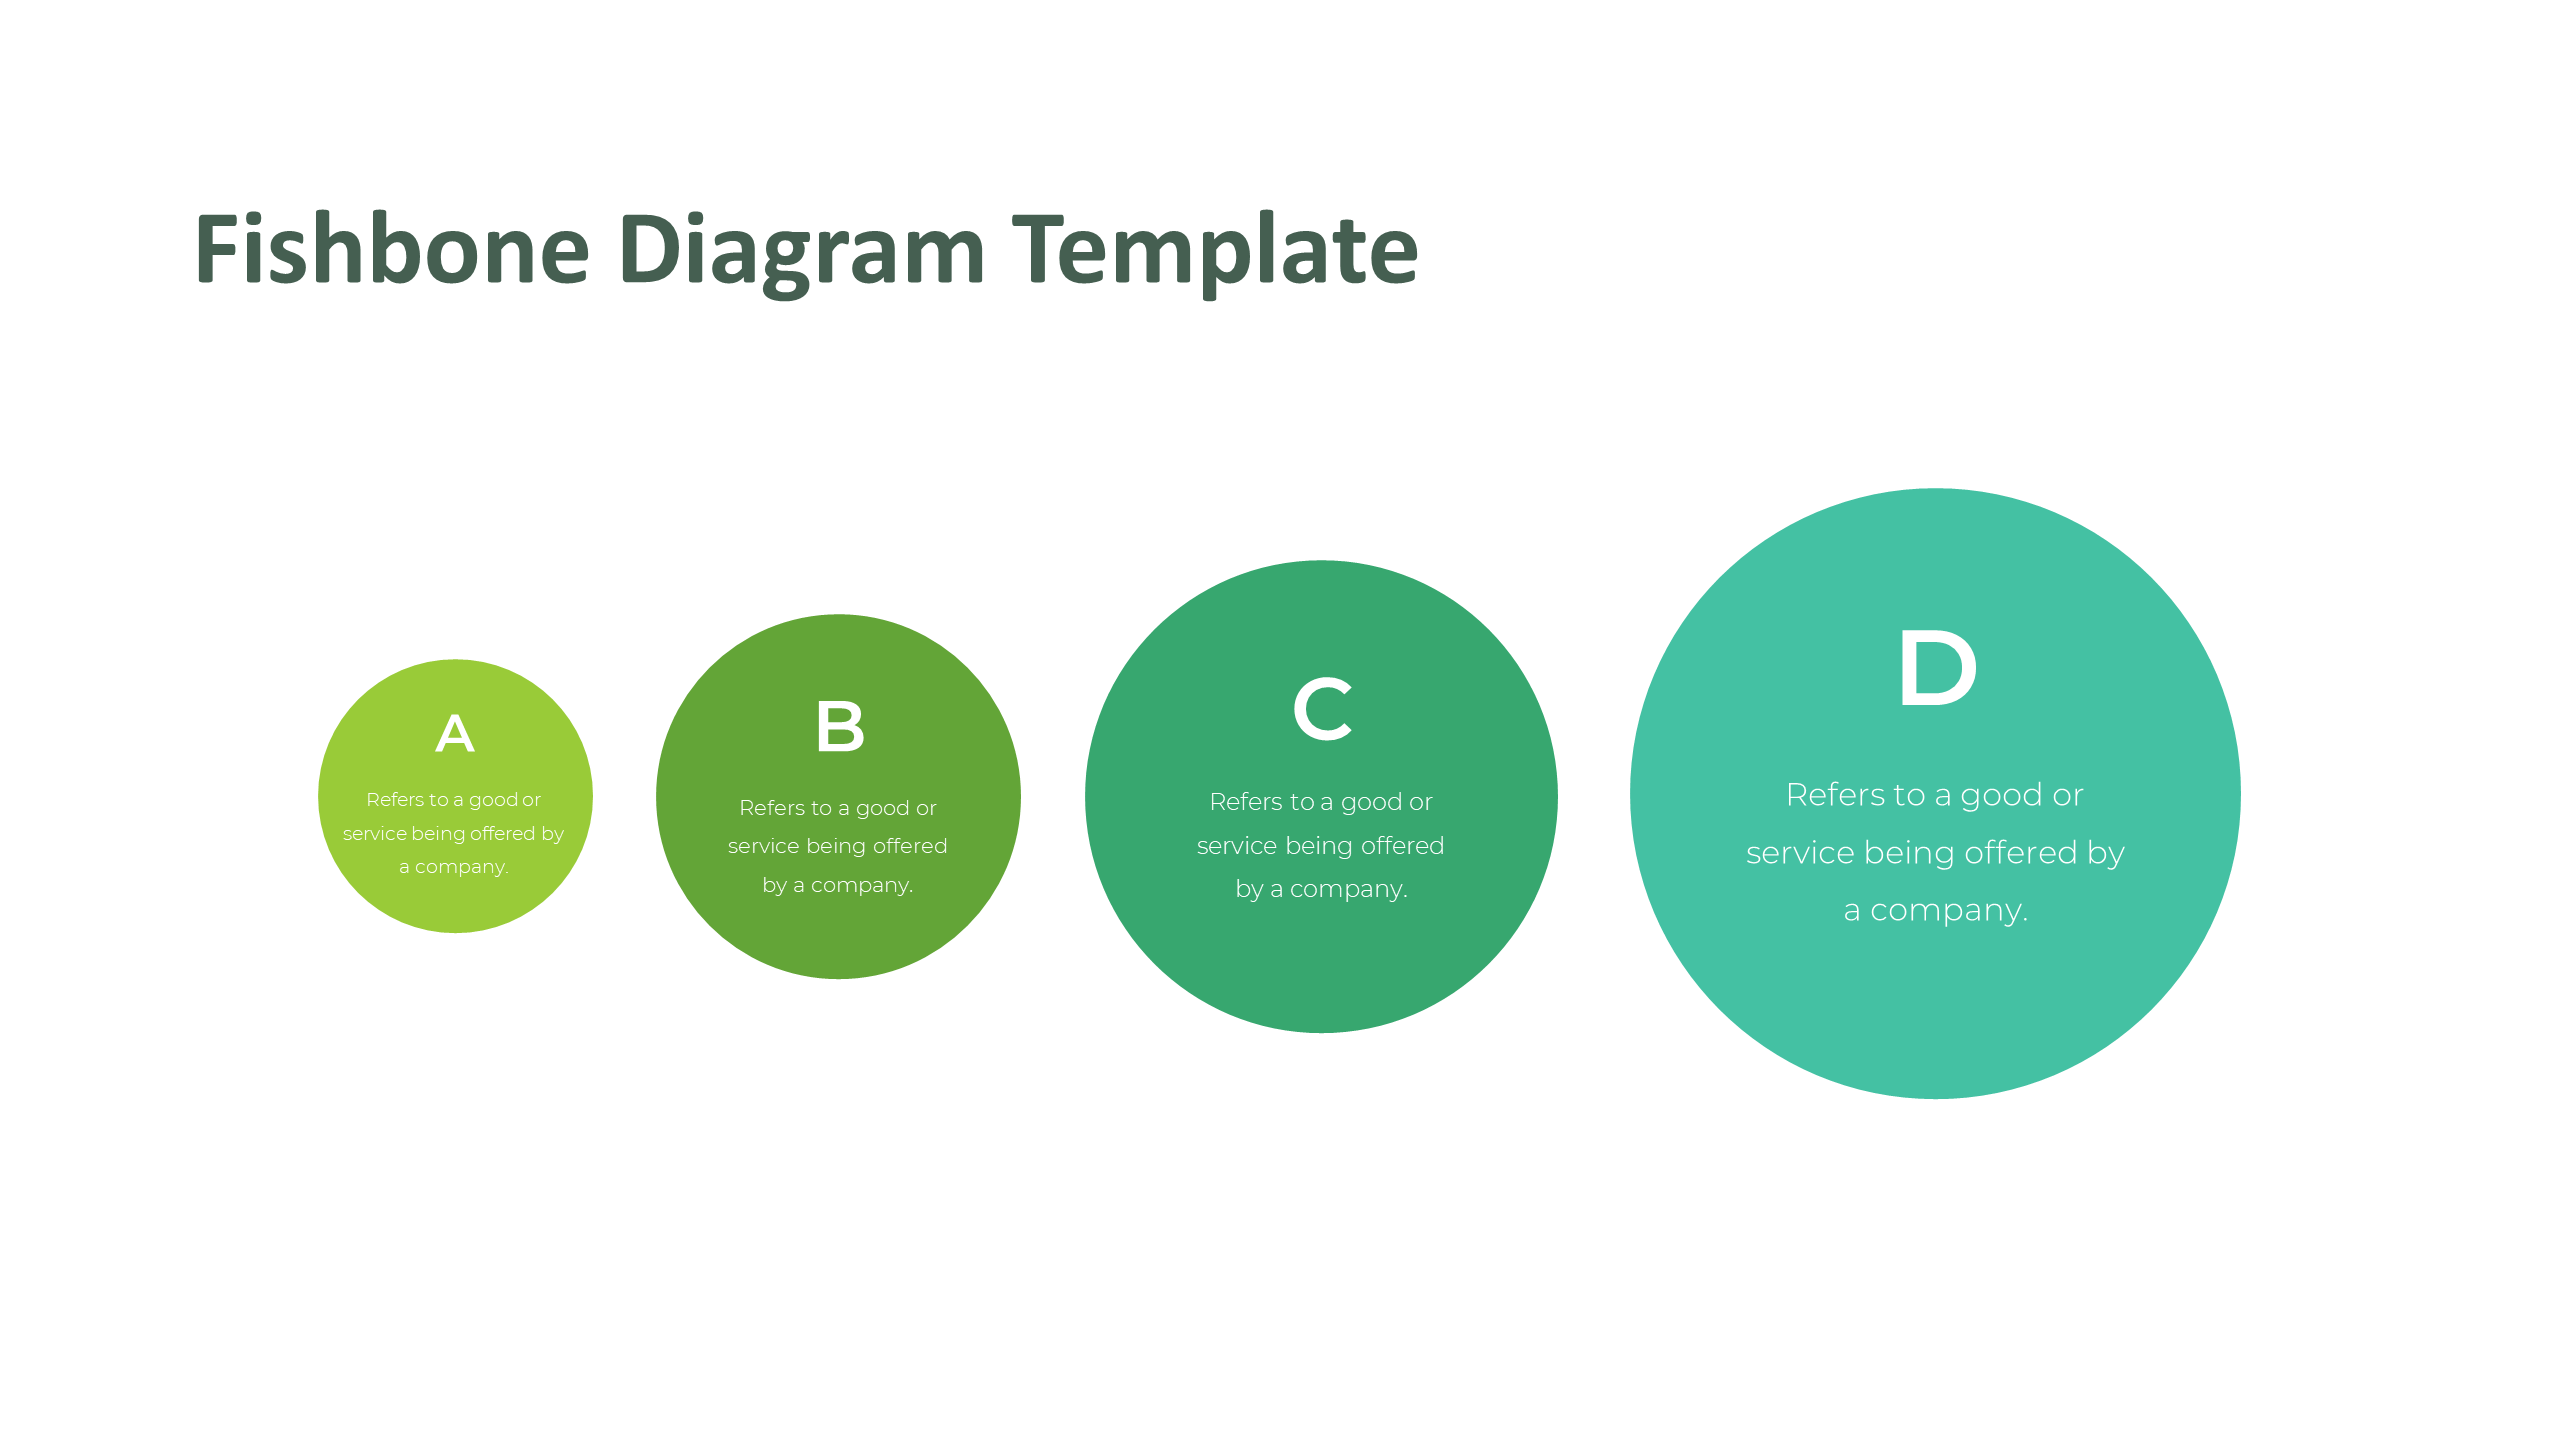
Download Free FishBone Analysis Templates
Template Categories
Mastering Fishbone Analysis with Our Free PowerPoint Template. Download Now For Free
Introduction:
In the realm of problem-solving and decision-making, the Fishbone Analysis, also known as the Ishikawa or cause-and-effect diagram, is a potent tool. It’s designed to help teams identify, explore, and visually exhibit the potential causes of a specific issue or quality variation. We’re thrilled to present our free Fishbone Analysis PowerPoint template, crafted to make this process more straightforward and efficient.
What is Fishbone Analysis?
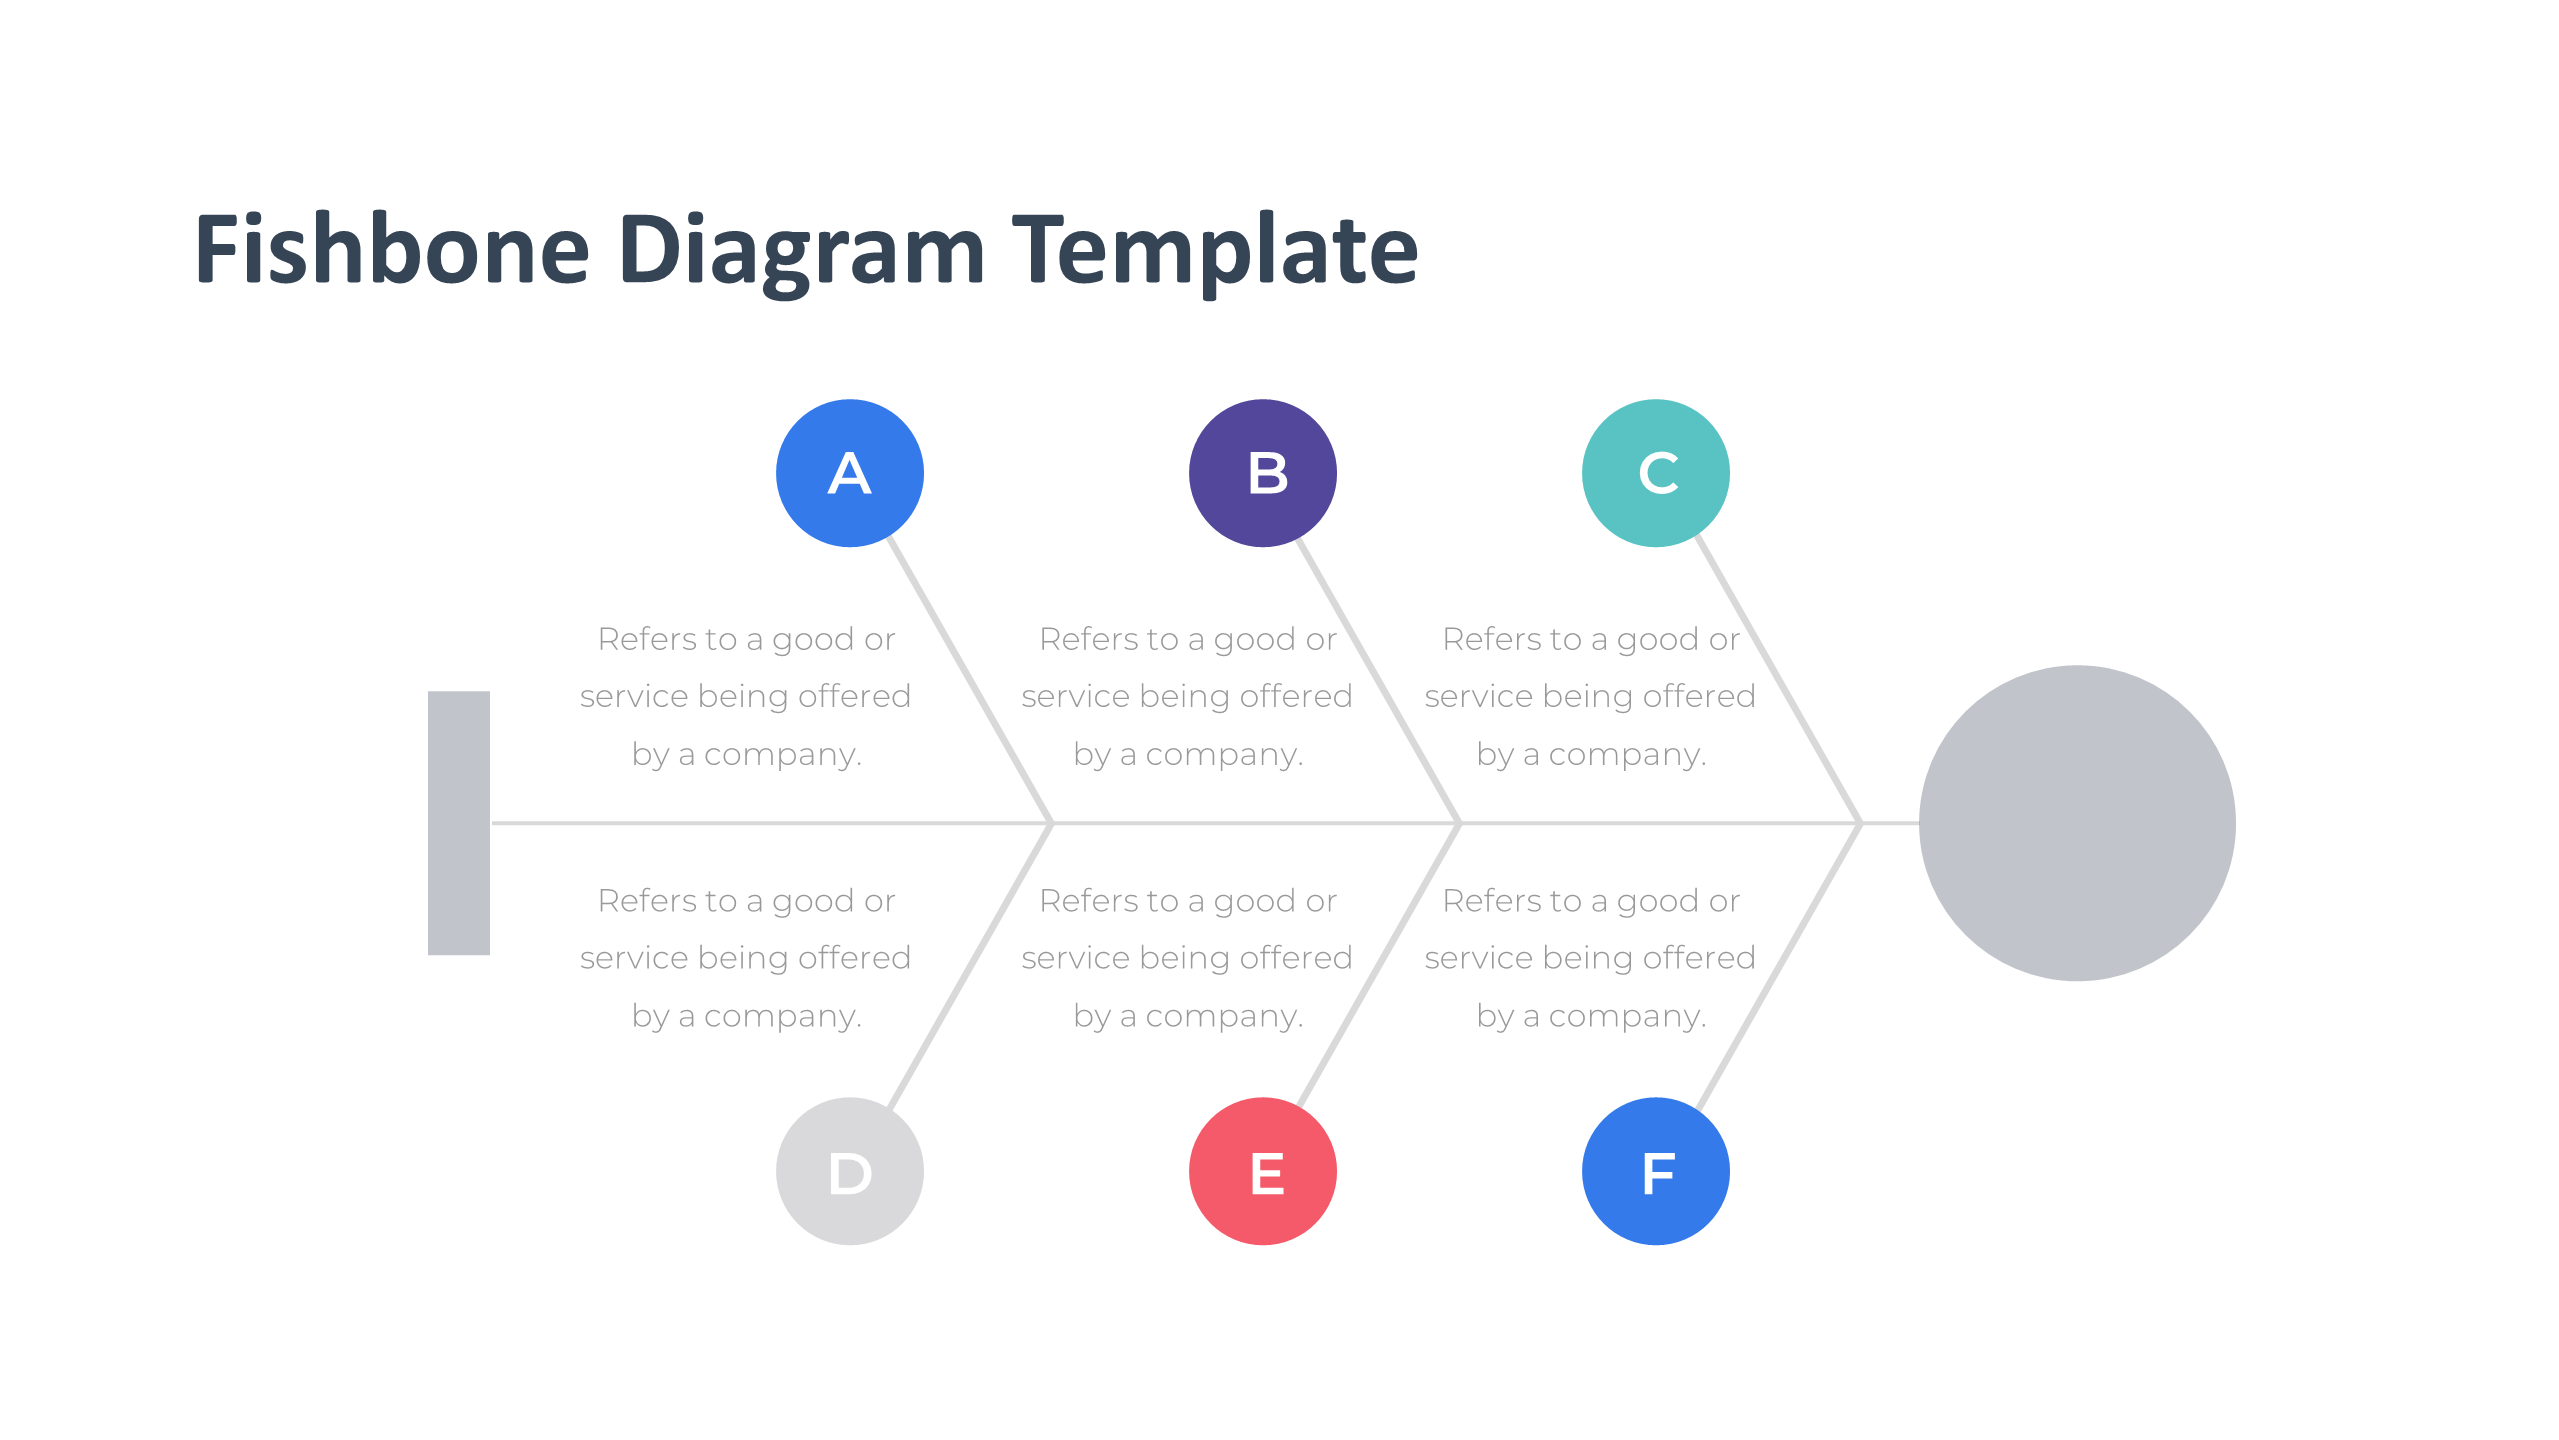
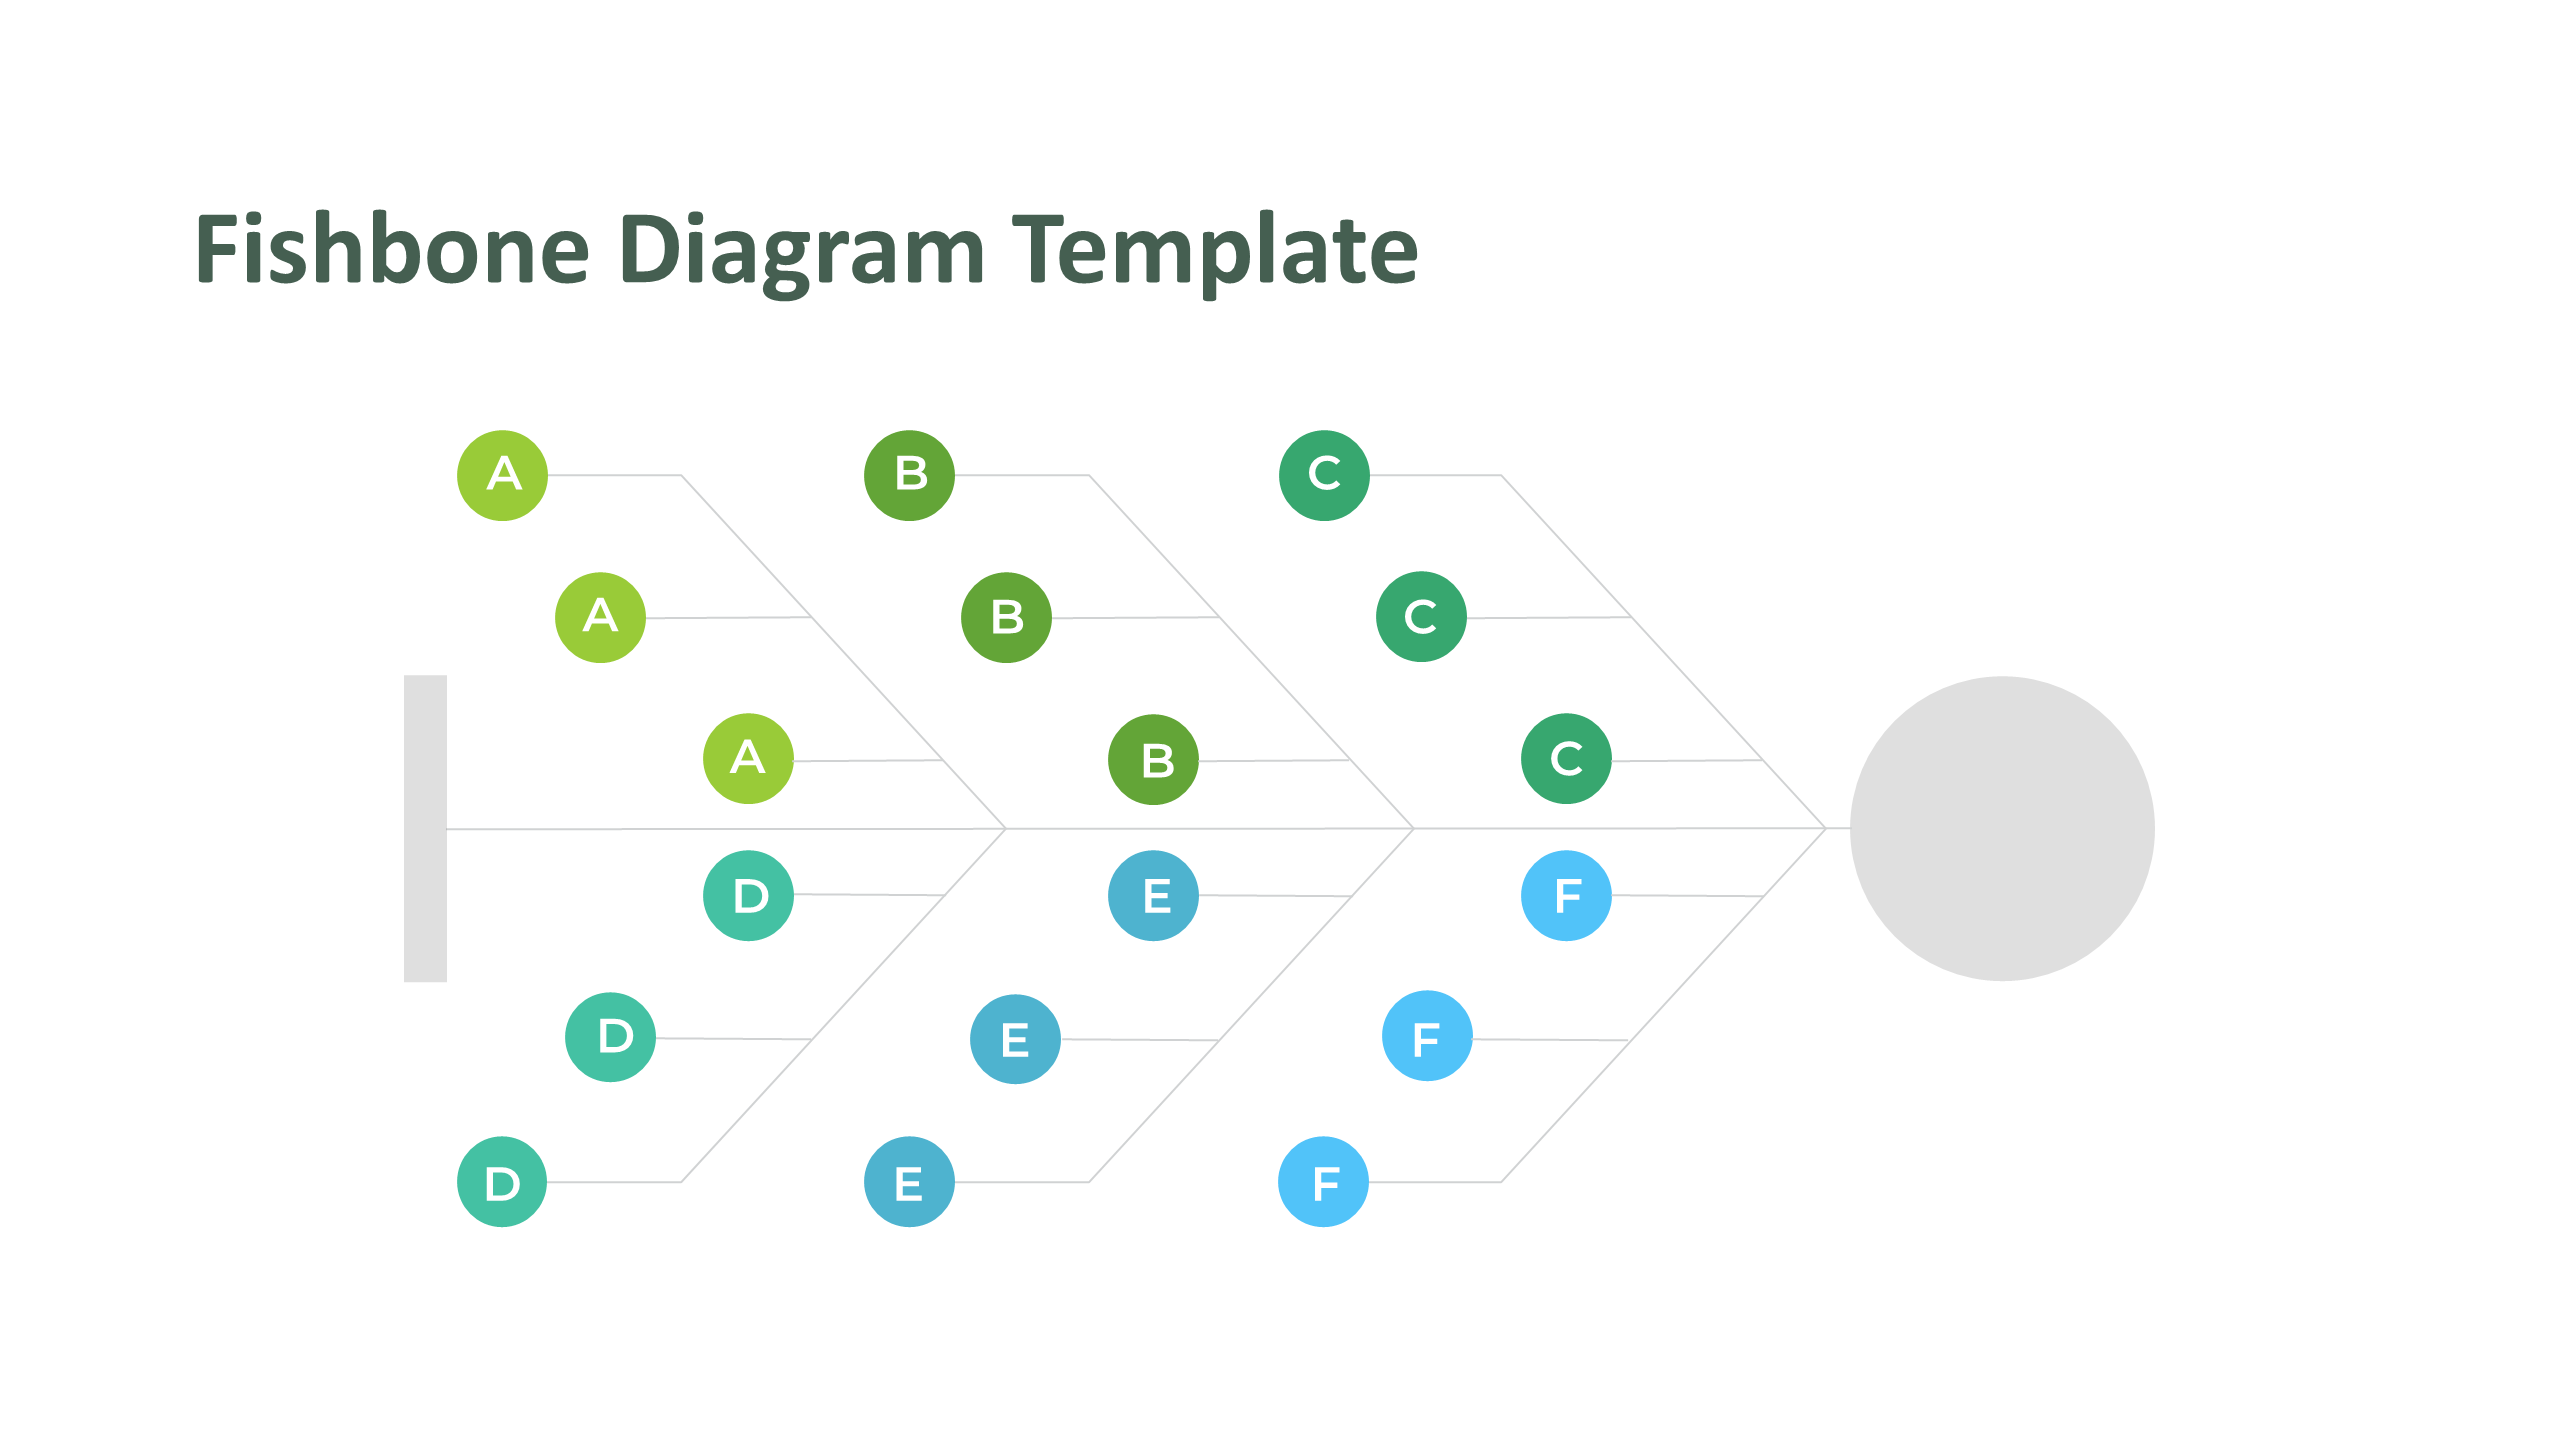
Fishbone Analysis is a structured brainstorming technique that aims to identify and visually display the potential causes of a specific problem. The diagram resembles a fish’s skeleton, with the main problem represented as the fish’s head and the causes as the bones. For instance, if a restaurant is experiencing a decline in customer satisfaction, the “head” of the fish would be “Decreased Customer Satisfaction.”
Why Use Fishbone Analysis?
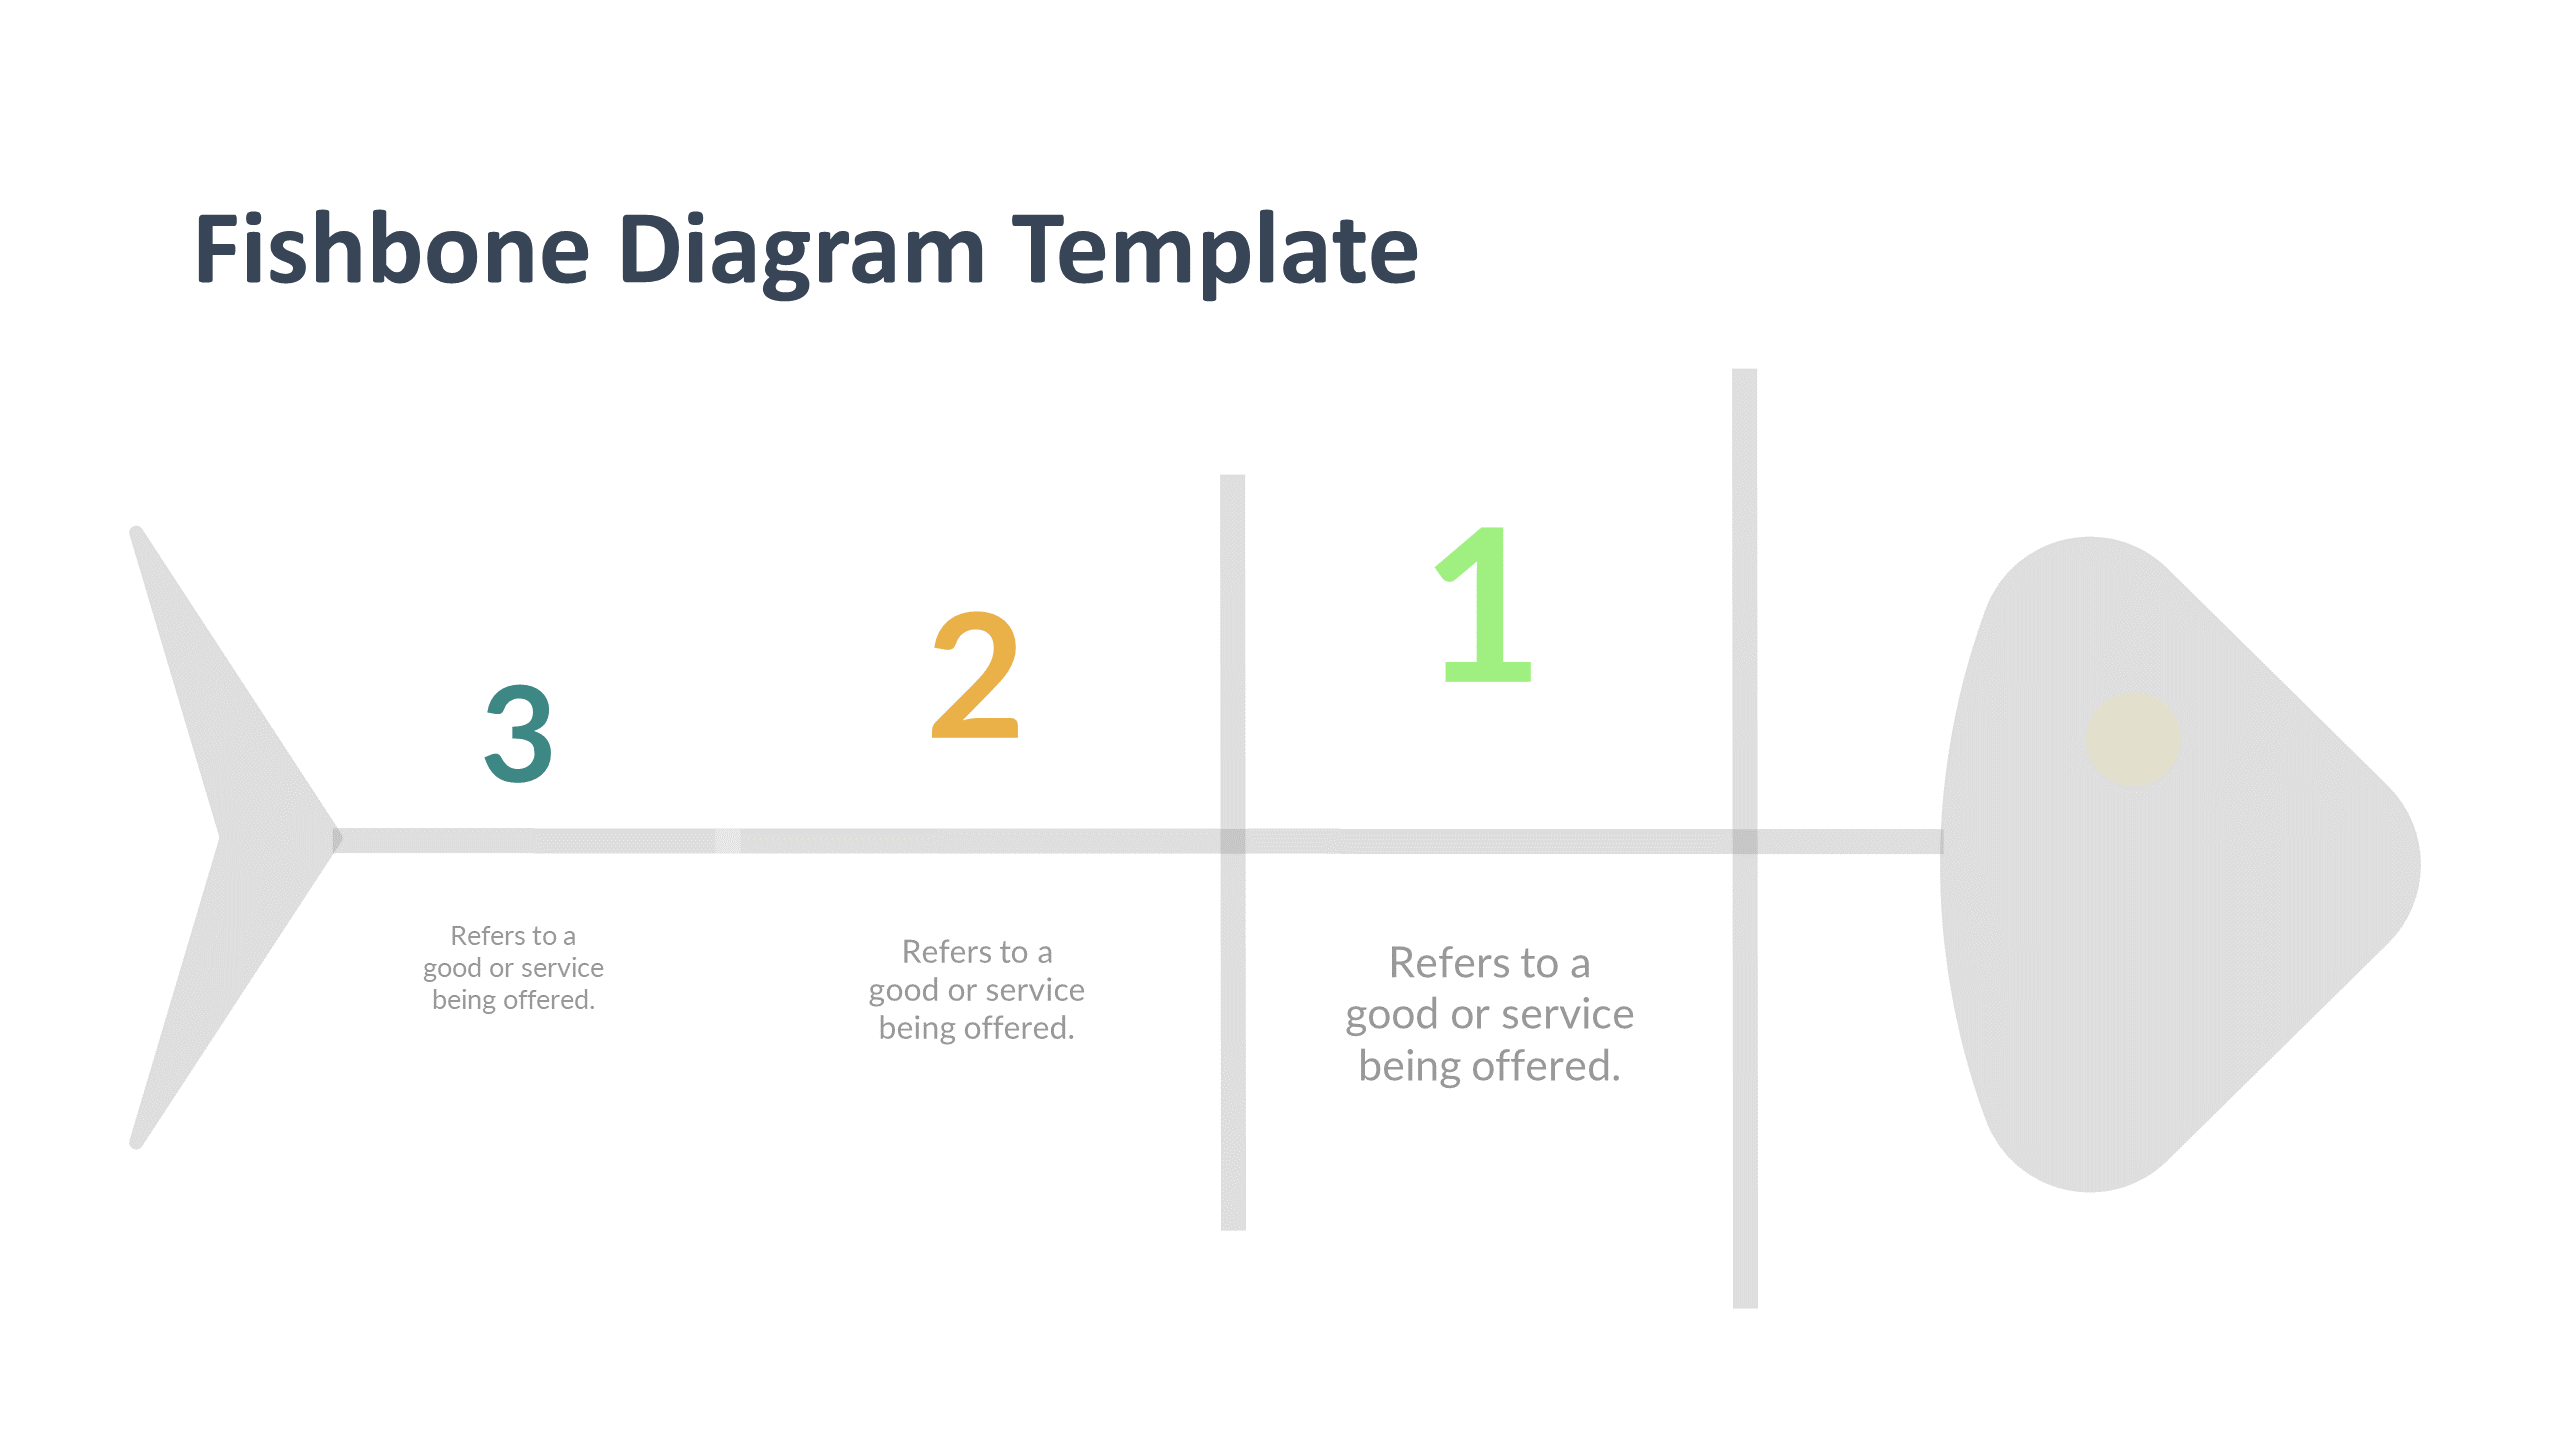
The Fishbone Analysis serves as a visual representation of the relationship between a problem and its potential causes. It encourages teams to consider all possible causes, rather than focusing on the most obvious ones. For example, in the restaurant scenario, potential causes could include “Poor Service,” “Low Food Quality,” “High Prices,” etc., rather than just blaming it on a single factor.
Benefits of Using Our Fishbone Analysis PowerPoint Template:
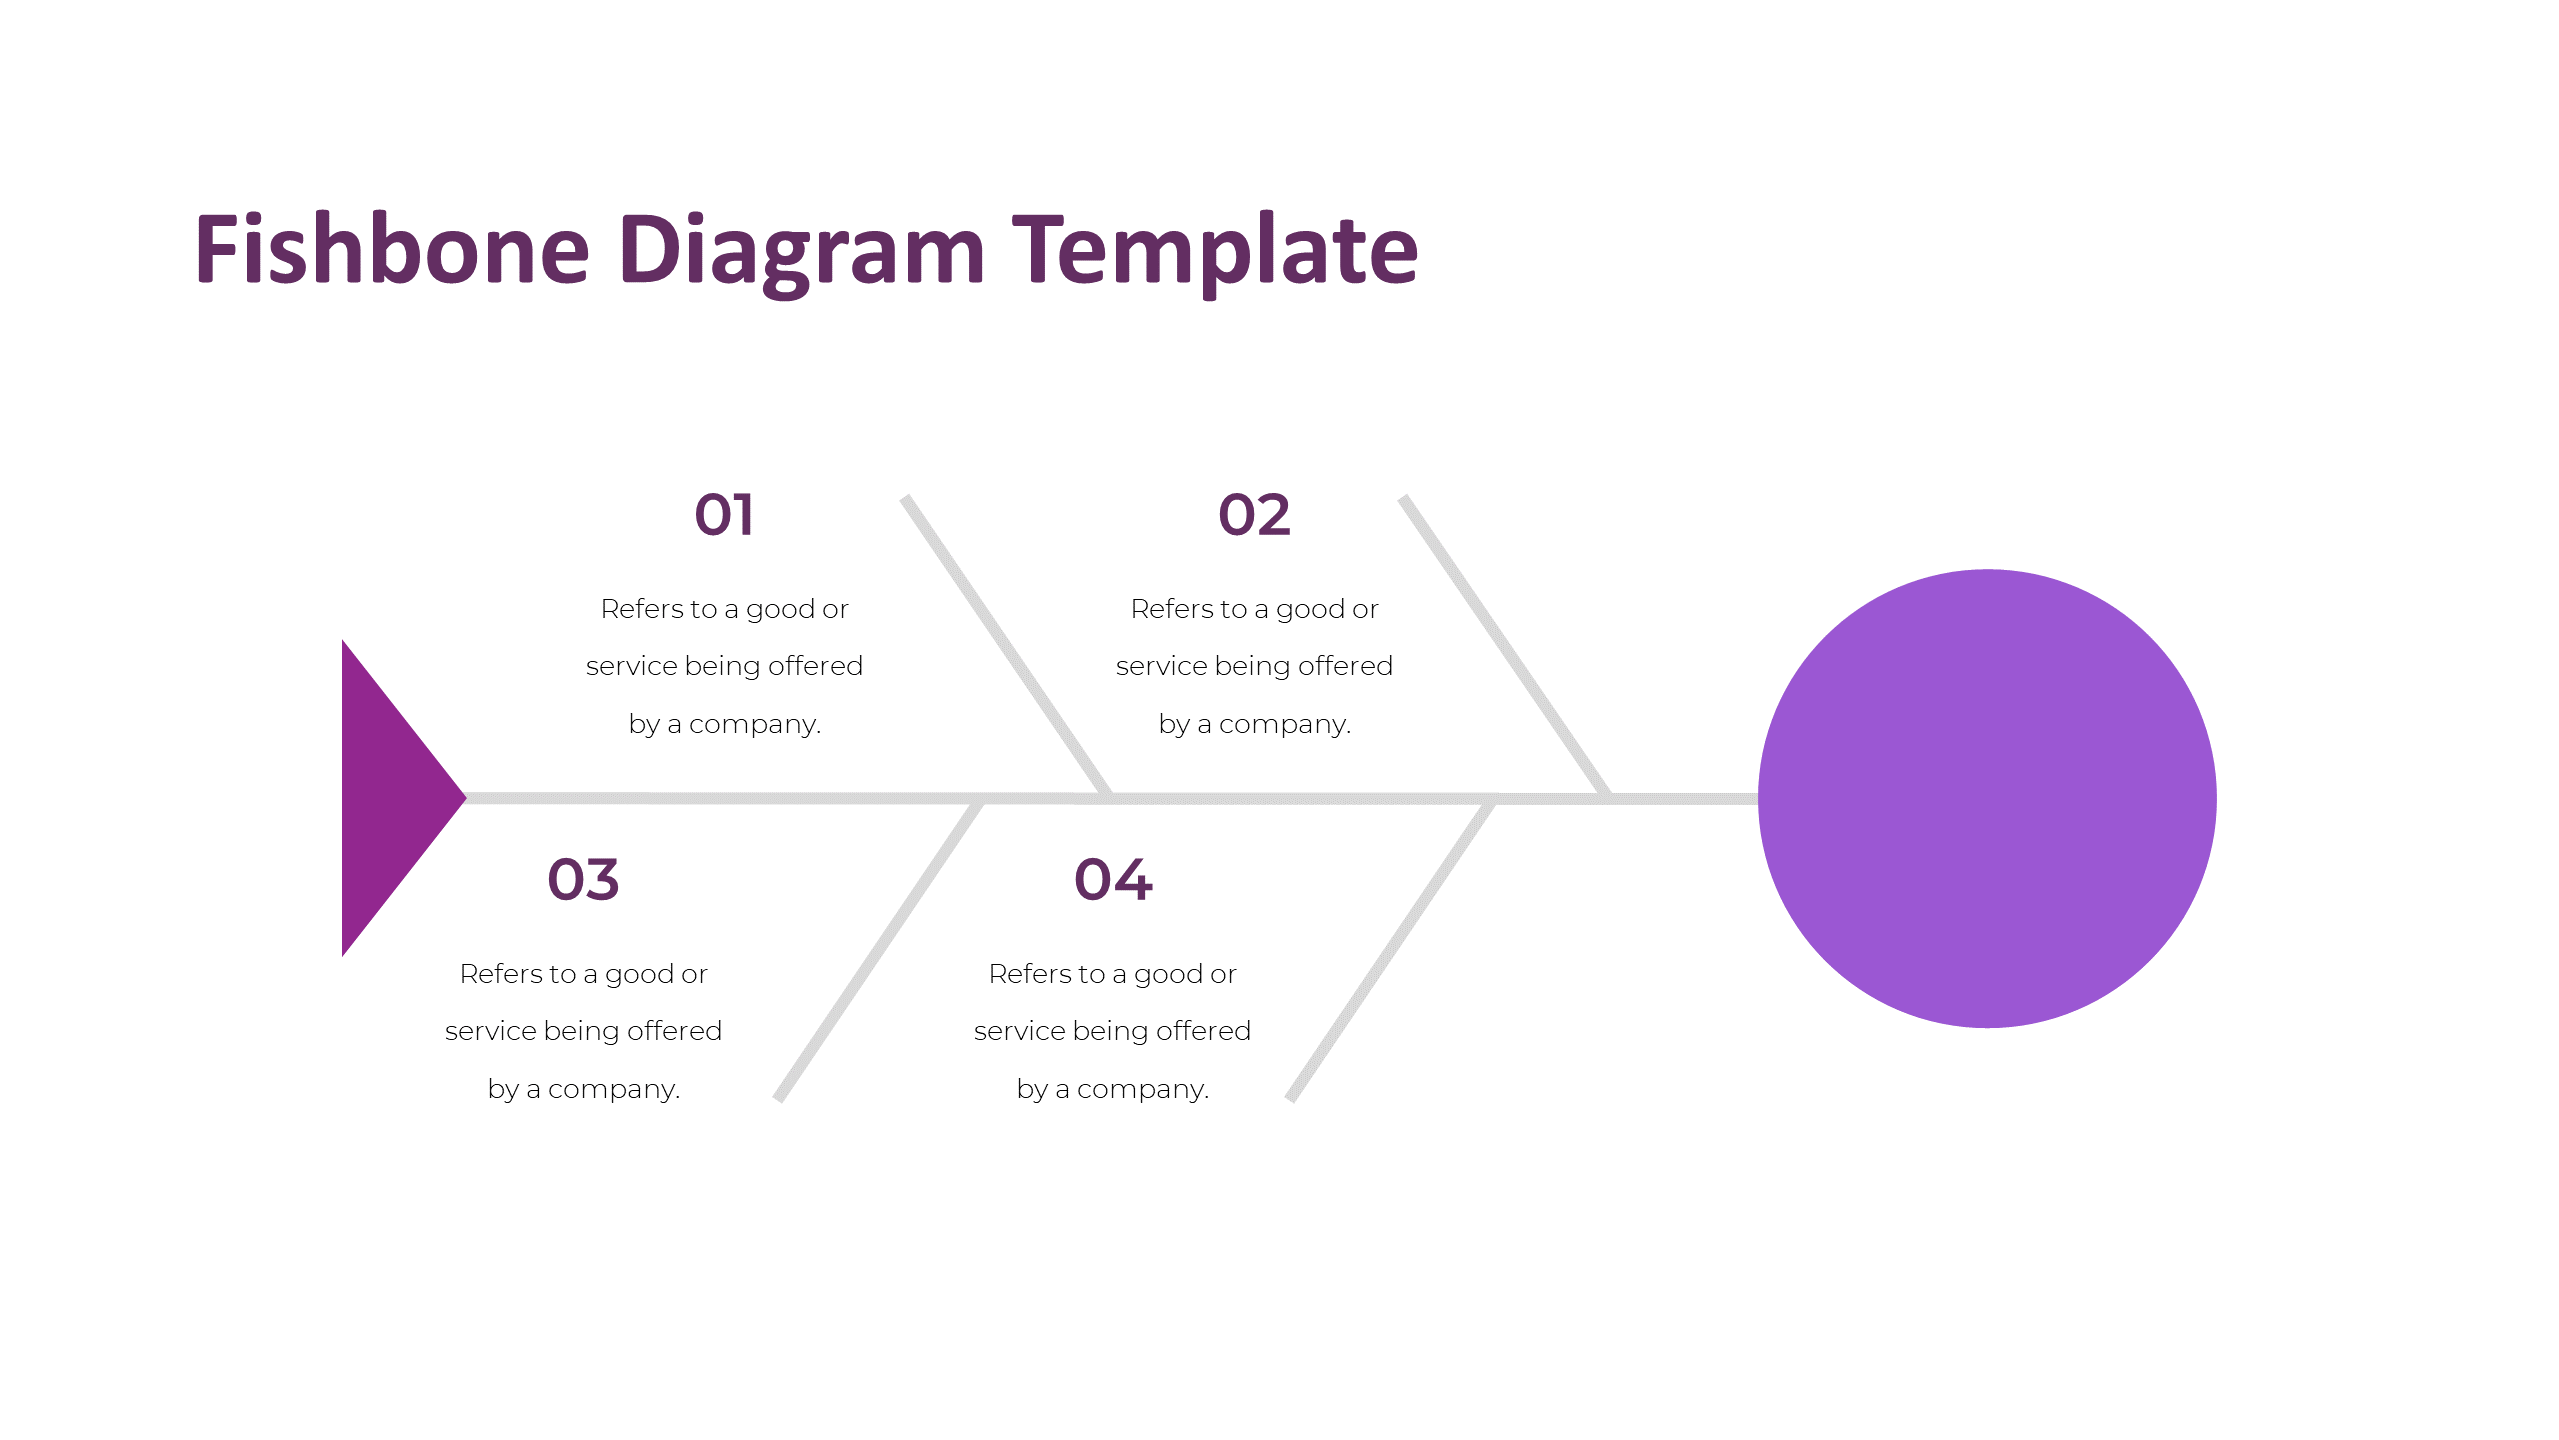
Our Fishbone Analysis PowerPoint template is designed to streamline the process of conducting a Fishbone Analysis. It provides a clear, easy-to-understand layout that can be customized to fit your specific needs. For instance, the restaurant could use the template to categorize the potential causes into “Service,” “Food,” “Price,” and “Ambience,” making the problem easier to understand and tackle.
How to Use Our Fishbone Analysis PowerPoint Template:
- Identify the Problem: Start by clearly defining the problem you want to solve. This will be the “head” of your fish. For example, “Decreased Customer Satisfaction.”
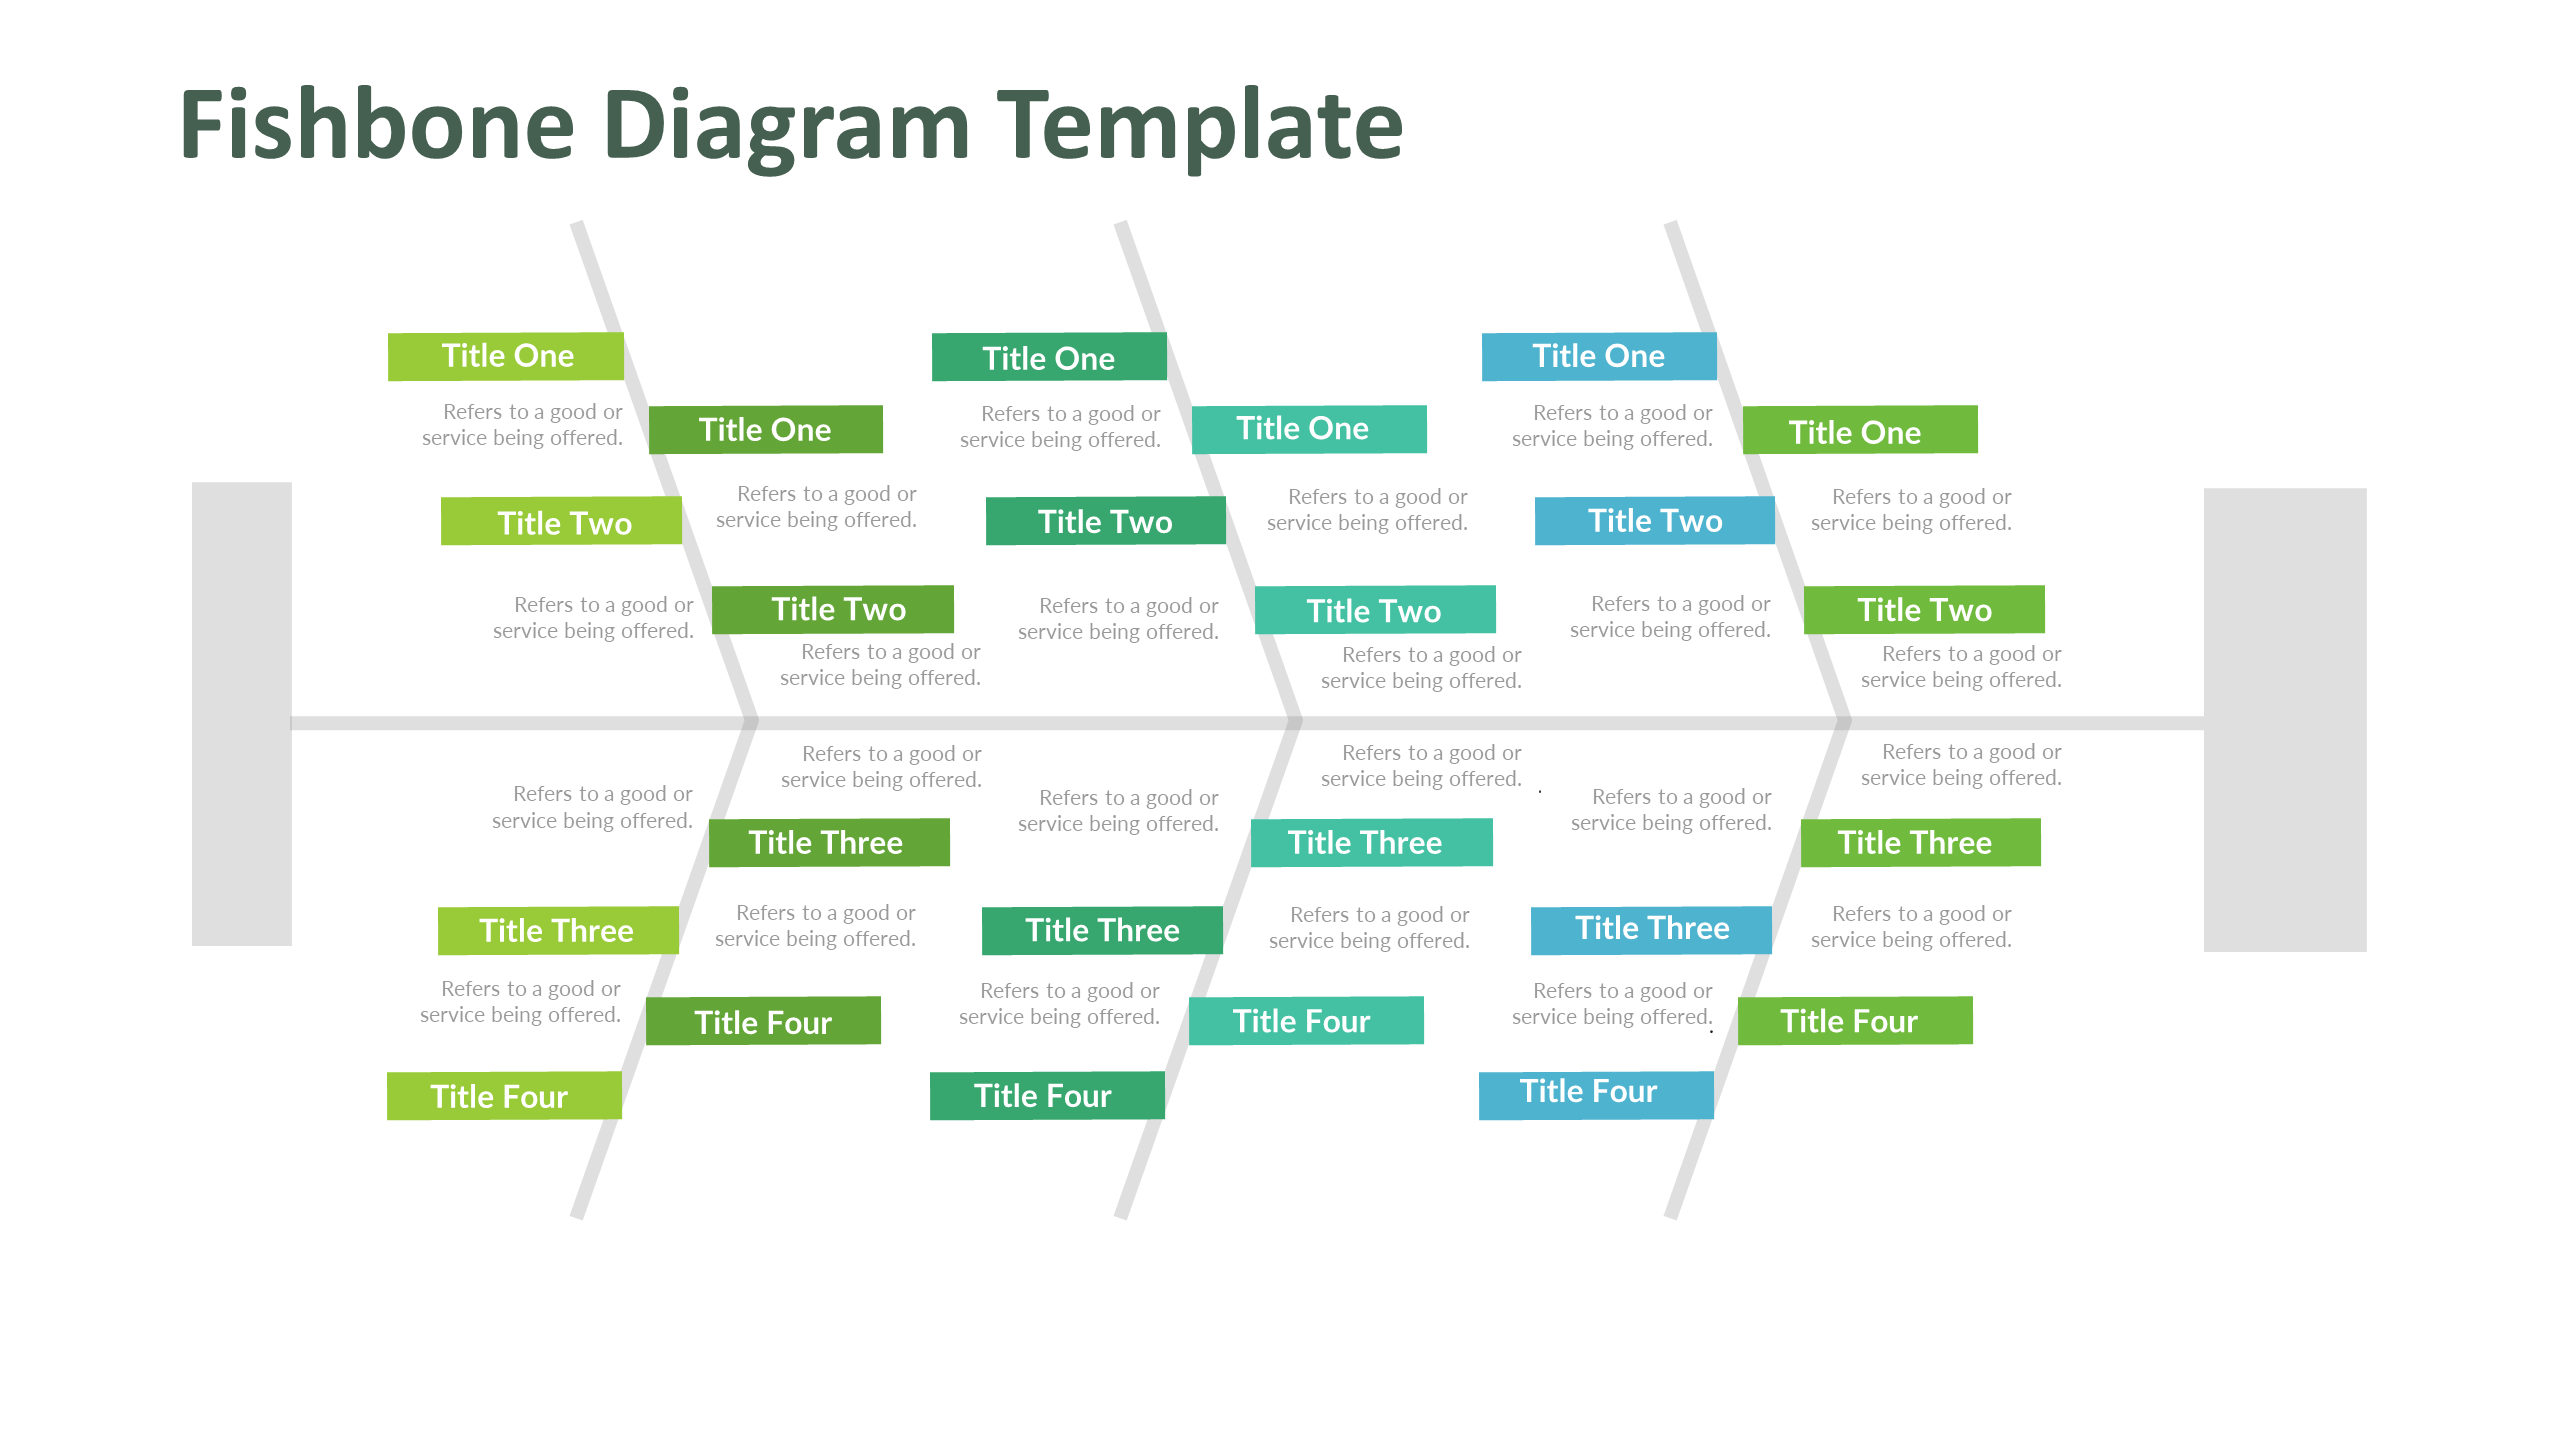
- Identify the Major Factors: Next, identify the major factors or categories that may be contributing to the problem. These will be the “bones” of your fish. In our example, these could be “Service,” “Food,” “Price,” and “Ambience.”
- Identify Potential Causes: For each major factor, brainstorm potential causes. These will be the smaller “bones” branching off the main ones. For instance, under “Service,” potential causes could be “Slow Service,” “Unfriendly Staff,” etc.
- Analyze and Take Action: Once you’ve identified all potential causes, analyze them to determine which are most likely contributing to the problem. Then, develop and implement a plan to address these causes. For example, if “Slow Service” is identified as a significant cause, the restaurant could implement staff training or hire more staff to improve service speed.
Example for Fishbone Root Cause Analysis:
let’s consider a detailed example of a Fishbone Analysis for a manufacturing company experiencing a high rate of product defects.
Title: Fishbone Analysis: Tackling Product Defects in Manufacturing
Introduction:
A manufacturing company, XYZ Corp., has been experiencing a high rate of product defects. This issue has led to increased costs, customer dissatisfaction, and a decline in overall product quality. To address this problem, the company decides to conduct a Fishbone Analysis using our free PowerPoint template.
Step 1: Identify the Problem
The first step in the Fishbone Analysis is to identify the problem. In this case, the problem is “High Rate of Product Defects.” This becomes the “head” of the fish in the Fishbone Diagram.
Step 2: Identify the Major Factors
Next, the team at XYZ Corp. identifies the major factors that could be contributing to the problem. After brainstorming, they identify four major categories: “Materials,” “Machinery,” “Methods,” and “Manpower.” These become the “bones” of the fish.
Step 3: Identify Potential Causes
For each major factor, the team then identifies potential causes:
- Materials: Poor quality materials, incorrect materials used, inconsistent material supply.
- Machinery: Outdated machinery, improper machine operation, lack of machine maintenance.
- Methods: Inefficient production process, lack of quality control, inadequate training.
- Manpower: Insufficient staff, lack of skilled workers, low staff morale.
Each of these potential causes becomes a smaller “bone” branching off from the main ones.
Step 4: Analyze and Take Action
After identifying all potential causes, the team analyzes them to determine which are most likely contributing to the high rate of product defects. They find that poor quality materials, outdated machinery, and an inefficient production process are the primary culprits.
To address these issues, XYZ Corp. decides to source higher quality materials, invest in machinery upgrades, and review their production process for potential improvements. They also decide to implement regular quality checks to catch defects earlier in the production process.
Conclusion:
By using the Fishbone Analysis and our free PowerPoint template, XYZ Corp. was able to identify the root causes of their high product defect rate and develop a plan to address them. This process helped them improve their product quality, reduce costs, and increase customer satisfaction.
This example illustrates how a Fishbone Analysis can be used to identify and address the root causes of a problem. By visually mapping out the potential causes, it becomes easier to understand the problem and develop effective solutions.
Conclusion:
Our free Fishbone Analysis PowerPoint template is a powerful tool that can help you conduct a thorough and effective Fishbone Analysis. By visually displaying the potential causes of a problem, it can lead to a more comprehensive understanding and effective solutions. Download it today and start solving problems more effectively!
Explore Our Free PowerPoint Presentation Templates and Infographic slides at PPTX Templates
Templates and designs for PowerPoint Presentations and Google Slides are uploaded frequently in our portal. Visit us for more presentations. You can simply select the template of your choice or explore using our advanced search tool and navigation menu. Create the best and Professional Presentation Template with PPTX Templates. These are pre-built multi slide presentation templates for various industries and scenarios.